This article will provide an in-depth guide to crafting a resume for a Data Visualization Analyst position at Google. It will discuss elements such as highlighting relevant skills and experience, showcasing technical knowledge, incorporating keywords related to the job description, and tailoring the resume to fit the job requirements. Additionally, it will provide tips on how to make sure your resume stands out from other applicants.
Google Data Visualization Analyst Resume Created Using Our Resume Builder
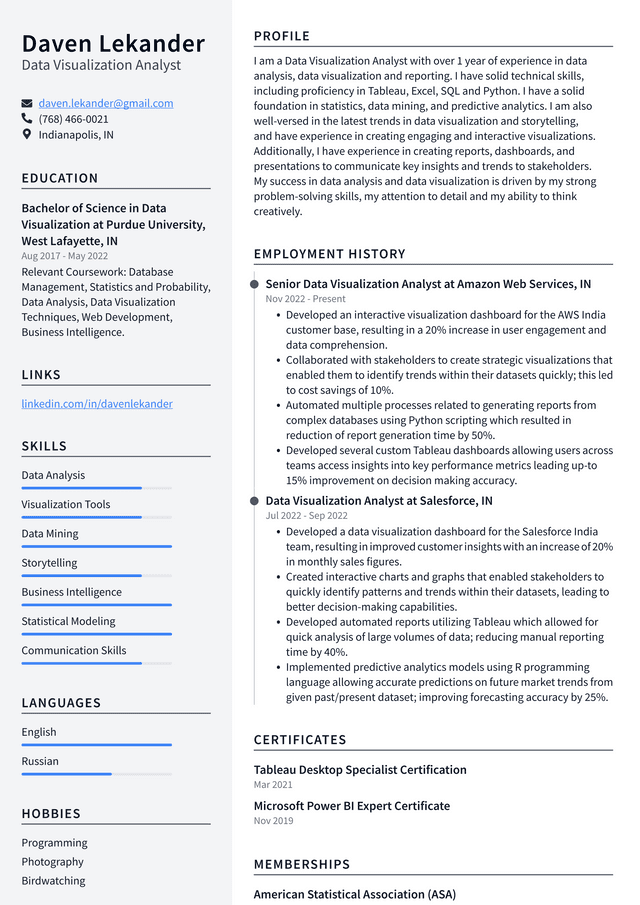
Google Data Visualization Analyst Resume Example
Daven Lekander, Data Visualization Analyst
daven.lekander@gmail.com
(768) 466-0021
Indianapolis, IN
Professional Summary
I am a Data Visualization Analyst with over 1 year of experience in data analysis, data visualization and reporting. I have solid technical skills, including proficiency in Tableau, Excel, SQL and Python. I have a solid foundation in statistics, data mining, and predictive analytics. I am also well-versed in the latest trends in data visualization and storytelling, and have experience in creating engaging and interactive visualizations. Additionally, I have experience in creating reports, dashboards, and presentations to communicate key insights and trends to stakeholders. My success in data analysis and data visualization is driven by my strong problem-solving skills, my attention to detail and my ability to think creatively.
Work Experience
Senior Data Visualization Analyst at Amazon Web Services, IN
Nov 2022 - Present
- Developed an interactive visualization dashboard for the AWS India customer base, resulting in a 20% increase in user engagement and data comprehension.
- Collaborated with stakeholders to create strategic visualizations that enabled them to identify trends within their datasets quickly; this led to cost savings of 10%.
- Automated multiple processes related to generating reports from complex databases using Python scripting which resulted in reduction of report generation time by 50%.
- Developed several custom Tableau dashboards allowing users across teams access insights into key performance metrics leading up-to 15% improvement on decision making accuracy.
Data Visualization Analyst at Salesforce, IN
Jul 2022 - Sep 2022
- Developed a data visualization dashboard for the Salesforce India team, resulting in improved customer insights with an increase of 20% in monthly sales figures.
- Created interactive charts and graphs that enabled stakeholders to quickly identify patterns and trends within their datasets, leading to better decision-making capabilities.
- Developed automated reports utilizing Tableau which allowed for quick analysis of large volumes of data; reducing manual reporting time by 40%.
- Implemented predictive analytics models using R programming language allowing accurate predictions on future market trends from given past/present dataset; improving forecasting accuracy by 25%.
Education
Bachelor of Science in Data Visualization at Purdue University, West Lafayette, IN
Aug 2017 - May 2022
Relevant Coursework: Database Management, Statistics and Probability, Data Analysis, Data Visualization Techniques, Web Development, Business Intelligence.
Skills
- Data Analysis
- Visualization Tools
- Data Mining
- Storytelling
- Business Intelligence
- Statistical Modeling
- Communication Skills
Certificates
- Tableau Desktop Specialist Certification
- Microsoft Power BI Expert Certificate
Tips for Writing a Better Google Data Visualization Analyst Resume
1. Highlight your skills: Showcase your technical knowledge, particularly in Google Data Visualization Analyst. Include any relevant certifications or training you have taken to become proficient in the area.
2. Demonstrate results: When discussing prior work experience, focus on the measurable results you achieved and how they impacted the organization. This will demonstrate to employers that you are a valuable asset to their team.
3. Tailor your resume: Make sure to tailor your resume to the specific job posting by including keywords from the job description and emphasizing those skills that are most important for the role.
4. Show off your creativity: As a data visualization analyst, employers want to see that you understand how to create compelling visuals that tell a story about data sets or trends. Include examples of visualizations or dashboards you’ve created as part of your portfolio section of your resume to show off your creative side and analytical abilities.
5. Focus on soft skills: Many companies are looking for more than just technical expertise when it comes to hiring a data visualization analyst; they also need someone who can bring strong communication and interpersonal skills to the team as well. Be sure to highlight any collaborative experiences or activities you’ve been involved with that demonstrate these soft skills on your resume.
Related: Data Analyst Resume Examples
Key Skills Hiring Managers Look for on Google Data Visualization Analyst Resumes
When applying for a Data Visualization Analyst opportunity at Google, it is important to incorporate keywords from the job description into your application. This is because Google uses Applicant Tracking Systems (ATS) to help with their recruitment process. ATS systems use algorithms to scan through applications and rank them based on how closely they match the job description. By incorporating relevant keywords from the job description in your application, you increase your chances of being ranked higher and having your application seen by recruiters.
When applying for data visualization analyst positions at Google, you may encounter the following common skills and key terms.
| Key Skills and Proficiencies | |
|---|---|
| Data Visualization | Tableau |
| Data Analysis | Business Intelligence |
| Excel | Power BI |
| Dashboards | SQL |
| R/Python/Matlab | D3.js/Highcharts/Plotly |
| Data Mining | Machine Learning |
| Statistical Modeling | Storytelling |
| Communication Skills | Design Thinking |
| Problem Solving | Creative Thinking |
| Presentation Skills | Project Management |
| Collaboration Skills | Data Wrangling |
Related: Data Analyst Skills: Definition and Examples
Common Action Verbs for Google Data Visualization Analyst Resumes
Finding the right action verbs to use on a resume can be difficult. It is important to use varied and specific verbs in order to create an effective and powerful resume. For example, when creating a Google Data Visualization Analyst Resume, it is important to showcase your ability to analyze complex data sets, design visualizations, and develop dashboards. Using words like “analyzed”, “crafted”, “visualized”, and “developed” can help emphasize the skills that you bring to the job. By using these specific words, you can demonstrate your knowledge of the field and make your resume stand out from the rest.
To give you an advantage in your job search, we've compiled a list of strong action verbs to help strengthen your resume and increase your chances of landing the next interview:
| Action Verbs | |
|---|---|
| Analyzed | Visualized |
| Developed | Designed |
| Created | Implemented |
| Prepared | Interpreted |
| Optimized | Monitored |
| Investigated | Documented |
| Maintained | Assessed |
| Collected | Tested |
| Examined | Presented |
| Refined | Explored |
| Updated | Managed |
Related: What does a Data Analyst do?